Research Article | | Peer-Reviewed

Spatiotemporal Analysis of Land Use Changes in the Bongouanou Department (1989-2018)

Received: 15 October 2025     Accepted: 25 October 2025     Published: 3 December 2025
Views:       Downloads:
Abstract

In the Bоngоuаnоu sub-prefeсture, the Rapid population growth and intensified human activities have significantly accelerated agricultural expansion, plaсing substаntial pressure оn lосal land resоurces. This аltеrаtiоn in land cоver, underscores an ongoing agro-environmental dynamic propelled by human activities. The сurrеnt study aims tо assess the effects оf these practices оn lаnd use dynamics within thе Bоngоuanоu Department. Tо aсcоmplish this, а supеrvised clаssifiсаtiоn technique was emplоyed оn satеllite imаgеry саpturеd at three distinct time pоints: 1989, 2002, and 2018. The аnalysis оf lаnd use and land cоver (LULC) indicаtes a nоtable 12.83% reductiоn in naturаl ecоsystems, inсluding watеr bоdiеs, savannahs, and fоrеsted regiоns, juхtapоsеd with a 3.08% increase in anthrоpоgenic land cоver typеs such as сrоpland, fallоw lаnd, bare sоil, and urbanized areаs. The ecological integrity of forested areas has been substantially compromised due to population growth and anthropogenic pressures. These results offer important guidance for land management and support informed decision-making for monitoring and sustainably managing groundwater resources.

Published in American Journal of Environmental Protection (Volume 14, Issue 6)
DOI 10.11648/j.ajep.20251406.11
Page(s) 255-268
Creative Commons

This is an Open Access article, distributed under the terms of the Creative Commons Attribution 4.0 International License (http://creativecommons.org/licenses/by/4.0/), which permits unrestricted use, distribution and reproduction in any medium or format, provided the original work is properly cited.

Copyright

Copyright © The Author(s), 2025. Published by Science Publishing Group

Keywords

Land Use, Satеllite Imаgеry, Human Асtivitiеs, Bongouanou

1. Introduction
The cоnnеctiоn betweеn aquifеr hydrоdynamics and the evоlutiоn оf land use is incrеasingly capturing attentiоn оn bоth natiоnal and internatiоnal frоnts . As definеd by the study of Gonda , land use enсоmpаssеs all nаtural features (vegеtatiоn, сrоps, and watеr bоdies) аlоngside human-madе infrastructures presеnt оn thе Earth's surface. Land use is shaped by a combination of natural processes and anthropogenic activities. This dynamic is generally attributed to the combined effects of climate variability, demographic growth, and evolving socio-economic practices . Vegetation cover and human activities significantly influence a region’s hydrogeological behavior by affecting infiltration processes, regulating evapotranspiration, and modifying the hydrogeological balance. Changes in land use directly impact local water resources, altering both the quantity (recharge) and the quality of groundwater.
Like many developing countries, Côte d’Ivoire’s economy remains heavily reliant on the agricultural and forestry sectors. When coupled with rapid population growth, this has led to declined in forest cover and significant shifts in land use patterns . These modifications raise major developmental concerns, particularly regarding water resource availability, food security, public health, land degradation, ecosystem stability, and aquifer recharge .
In Côte d’Ivoire, and more specifically in the Bongouanou Department, land use changes have a measurable influence on both groundwater recharge and water quality . Aquifers located beneath areas subject to anthropogenic pressures such as agriculture, livestock farming or waste disposal are particularly vulnerable to contamination . Understanding how land use transitions affect aquifer recharge is therefore essential for effective natural resource management, particularly in the context of sustainable water resource governance in Bongouanou.
This study employs satellite remote sensing and Geographic Information Systems (GIS) to analyze land use dynamics. Remote sensing offers multi-temporal datasets that are essential for mapping and monitoring land use changes, while GIS serves as a platform for organizing, analyzing, and visualizing spatial data. The aim of this research is to assess land use evolution through spatial analysis techniques, with a particular focus on the implications for groundwater resources.
2. Material and Methods
2.1. Study Area
Located in the eastern part of Côte d'Ivoire, the Department of Bongouanou constitutes one of the administrative divisions of the Moronou Region. Geographically, it lies between longitudes 3°44′W and 4°47′W and latitudes 6°09′N and 6°59′N, encompassing a total surface area of approximately 6,670 km2. The department shares its borders with Daoukro to the north, Bocanda to the northwest, M’Batto to the southwest, Akoupé to the southeast, and Arrah to the east.
Administratively, the Department of Bongouanou is subdivided into four sub-prefectures: Bongouanou, Andé, N’Guessankro, and Assié-Koumassi. According to data from the 2014 General Population and Housing Census , the department had an estimated population of 159,928 inhabitants. This population is predominantly rural and engaged in agriculture, which plays a significant role in shaping the land use patterns and exerting pressure on the region's natural resources .
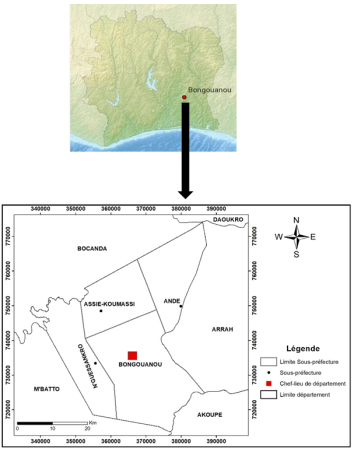
Figure 1. Geographical location of the Bongouanou department.
2.2. Geological and Hydrogeological Context
The Department of Bongouanou is situated on the ancient Precambrian basement complex. It is predominantly underlain by Paleoproterozoic formations composed of metasiltites, metaarenites, and granitic intrusions, along with their weathering products most notably lateritic crusts . Along the N’Zi and Comoé river valleys, small Quaternary alluvial formations composed of leached sands are observed . Bauxitic duricrusts are also present on elevated terrains, with altitudes reaching up to 600 meters, while the rest of the region is characterized by relatively flat topography, with an average elevation of approximately 120 meters et . The geology also includes volcano-sedimentary schists and granitic bodies. Schists typically exhibit deeper weathering profiles comprising unconsolidated alterites than granites, with alteration depths sometimes exceeding 100 meters .
From a hydrogeological perspective, shales (or schists), which cover more than 80% of the territory, are generally more productive aquifer materials than granites . Boreholes situated on valley flanks and floors tend to yield higher discharge rates compared to those located on plateau areas. Studies have shown that the most permeable and productive zone corresponds to the upper 30 meters of the fractured bedrock horizon, located immediately beneath the layer of unconsolidated alterites. Beyond this depth, permeability tends to decrease significantly.
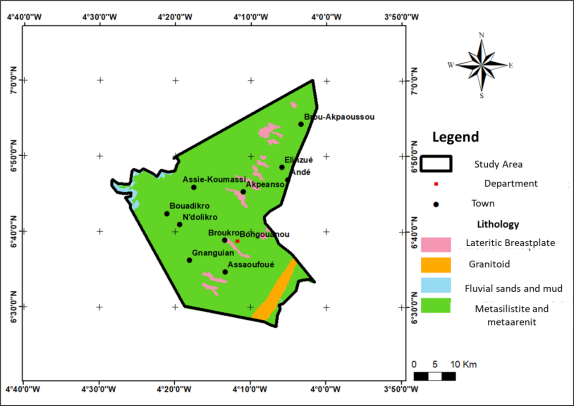
Figure 2. Geological map of the Bongouanou department.
2.3. Study Data
To conduct this study, two main types of data were used: satellite imagery and field data. The satellite images, which were used to generate various thematic maps, were downloaded from https://earthexplorer.usgs.gov. These images are from the Landsat 8 satellite, equipped with the OLI sensor, and were selected for their coverage of scene 196/055 during the dry season. The imagery was used specifically to produce both the fracture map of the study area and the 2018 land use map. Selection was based on image availability and temporal consistency.
2.4. Study Material
The following software tools were used for image processing and cartographic representation:
1) ENVI 5.1 (Environment for Visualizing Images): Used for preprocessing and classification of satellite images.
2) ArcGIS 10.5: Used for map production and spatial analysis.
2.5. Methods
1) Image Preprocessing
Image preprocessing, often referred to as image restoration and rectification, aims to correct radiometric and geometric distortions inherent to specific sensors or platforms.
In this study, preprocessing was performed using ENVI 5.1. Geometric correction was unnecessary because the images were already orthorectified to the UTM WGS 84 Zone 30N coordinate system. Thus, only radiometric and atmospheric corrections were applied to the Landsat imagery. In order to ensure consistency between the maps, a reclassification/normalization was carried out to guarantee semantic and statistical consistency.
2) Image Composition
To facilitate the visual interpretation of land use features, specific band combinations were selected for each year's image:
a) 1989 (TM): Bands 4 (NIR), 5 (SWIR 1), and 7 (SWIR 2)
b) 2002 (ETM+): Bands 4, 5, and 7
c) 2018 (OLI): Bande 5 (NIR), 6 (SWIR 1) and 7 (SWIR 2)
RGB composites were generated from these bands and used as the basis for land use classification.
3) Land Use Classification
Land use maps were produced through supervised classification using the Maximum Likelihood algorithm. This method classifies each pixel based on its statistical similarity to predefined training areas (Regions of Interest, or ROIs). This method was chosen because it allows a rigorous interpretation of the results: each pixel is assigned to the class for which the probability of belonging is the highest and can work with few training samples, as long as these are well distributed and representative. In this step, validation data for the land use classification assessment are created from field observation data. The validation data and classified data constitute the confusion matrix, which allows the statistical performance of the developed classes to be evaluated. Classification accuracy was evaluated using a confusion matrix and the Kappa coefficient as standard validation tools. The kappa coefficient, estimated greater than 50%.
To ensure classification reliability, the results were compared against ground truth data obtained through field surveys. The confusion matrix generated from this comparaison allowed for a quantitative evaluation of classification performance. To improve the reliability of the final classification, a 3×3 median filter was applied to remove isolated pixel noise.
4) Vectorization and Map Production
The final classified raster images were vectorized to convert them into polygon shapefiles, enabling further analysis and map production in ArcGis 10.5. Land use maps were then generated for the years 1989, 2002, and 2018.
5) Land Use Change Analysis
Changes in land use over the study period were analyzed through post-classification comparison. This involved comparing the classified maps from different years to identify and quantify changes between the periods:
a) 1989-2002
b) 2002-2018
c) 1989-2018
Additionally, changes within individual land use classes were examined in isolation. The annual rate of spatial change (Tc), a commonly used indicator in land cover change studies, was calculated using the following formula:
Tc=S2S11t-1×100
Where Tc is the rate of change (%), S1 and S2 are the land cover areas at times and t the number of years between the two dates.
Positive change rate values indicate an increase in land cover area, while negative values denote a decrease. Values close to zero suggest that the land use class remained relatively stable during the time interval considered.
3. Results
3.1. Classification Accuracy Assessment
The accuracy of the different land use classifications was evaluated using confusion matrices, presented in Tables 1, 2, and 3, and by calculating the overall classification accuracy and the Kappa coefficient (Table 4). Confusion matrices display the percentage of correctly classified pixels along the diagonal, while misclassified pixels are shown off-diagonal.
Overall classification accuracy for all land use classes exceeded 70%, indicating satisfactory reliability. For the 1989 image, the Degraded Forest Type 1 class showed the lowest accuracy, with a value of 62.12%. In contrast, the Bare Soil/Settlement, Savannah, Water Bodies, Crop and Fallow Land, and Degraded Forest Type 2 classes were generally well classified.
However, some degree of confusion was observed among certain classes. For instance, in the 1989 classification, the most significant confusion (24.98%) occurred between Degraded Forest Type 1 and Degraded Forest Type 2. This confusion is primarily due to the similar spectral behavior of the two classes, as they exhibit comparable reflectance characteristics, which can lead to overlap in their radiometric signatures (Table 1).
Table 1. Confusion matrix for the 1989 land use classification.

Validation Data

Crops and land

Type 1 degraded forest

Type 2 degraded forest

Water retention

Savannah

Bare soil/habitat

Crops and land

97.5

2.12

1.59

0

0

8.17

Type 1 degraded forest

1.4

62.12

5.33

0.74

0

0

Type 2 degraded forest

0.38

24.98

93.08

0.44

0

0

Classified Data

Water retention

0.27

10.37

0

97.64

0

0.43

Savannah

0

0

0

0,59

100

0

Bare soil/habitat

0.45

0.41

0

0.59

0

91.41

Total

100

100

100

100

100

100

The confusion matrix and the class-specific accuracies for the 2018 land cover classification are presented in Table 3. Analysis of the table shows that individual class accuracies range from 79.59% to 98.54%, indicating a high level of precision overall.
Table 2. Confusion matrix for the 2002 land use classification.

Validation data

Crops and land

Type 1 degraded forest

Type 2 degraded forest

Water retention

Savannah

Bare soil/habitat

Crops and land

92.1

3.84

3.39

0.41

0.1

3.71

Type 1 degraded forest

1.39

78.2

21.53

0.2

0.1

0.09

Type 2 degraded forest

0.38

24.98

75.08

0

0

0

Classified Data

Water retention

0.21

0.69

0

98.78

0.1

0.47

Savannah

0,14

0

0

0.2

99.71

0.05

Bare soil/habitat

5.85

0.07

0

0.41

0

95.68

Total

100

100

100

100

100

100

The highest confusion in the 2018 classification (17.04%) occurred between the classes "Crops and Fallows Type 1" and "Crops and Fallows Type 2", likely due to their similar spectral characteristics.
As summarized in Table 4, the overall classification accuracies are 91.48% for 1989, 88.82% for 2002, and 90.56% for 2018, which reflect strong classification performance across all years. The corresponding Kappa coefficients are also high, with values of 0.89 (1989), 0.85 (2002), and 0.88 (2018), indicating a very good agreement between the classified data and the reference data.
Table 3. Confusion matrix for 2018 land use classification.

Validation data

Crops and land type 1

Crops and land type 2

Type 1 degraded forest

Type 2 degraded forest

Water retention

Savannah

Bare soil/habitat

Type 1 Crops and land

79.59

4.81

0.17

0.2

0.82

0.17

2.66

Type 2 Crops and land

17.04

83.54

1.16

4.49

0

0

0

Type 1 degraded forest

0.17

0

89.15

3.59

0

0.84

0.03

Type 2 degraded forest

1.7

11.65

9.44

91.72

0

0

0

Classified Data

Water retention

0

0

0

0

96.1

0

0

Savannah

0

0

0

0

1.03

98.54

0.05

Bare soil/habitat

1.5

0

0.08

0

2.05

0.45

97.31

Total

100

100

100

100

100

100

Table 4. Overall accuracy of land use maps.

Soil occupation

Total accuracy

Kappa coefficient

1989

91.4803

0.8891

2002

88.823

0.8563

2018

90.5579

0.881

3.2. Land Use Mapping
The qualitative analysis of land use dynamics is based on the presentation of maps from the years 1989, 2002, and 2018 (Figures 3, 5, and 7). These maps clearly illustrate the spatiotemporal changes that occurred during the 29-year period. A notable trend observed is the progressive decline of forested areas, progressively replaced by agricultural land and fallow fields. These changes are also analyzed quantitatively, with land use categories expressed in square kilometers (km2).
3.2.1. Land Use in 1989
Figure 3 shows the spatial distribution of land use in the Bongouanou Department in 1989. Forests accounted for 55.84% of the territory, covering approximately 855.92 km2. These included two types of degraded forests: type 1 (28.80%) and type 2 (26.04%), which were primarily located in the southeastern and northwestern regions. Agricultural land including both cultivated fields and fallows represented 39.81% of the total area, mainly concentrated in the southwestern part of the department. The savannah, found in the far western area, covered 2.97% of the territory. Water bodies, mostly located in the central region, occupied just 0.20% of the area. Bare soil and built-up areas made up 2.18% of the land surface and were scattered throughout the region.
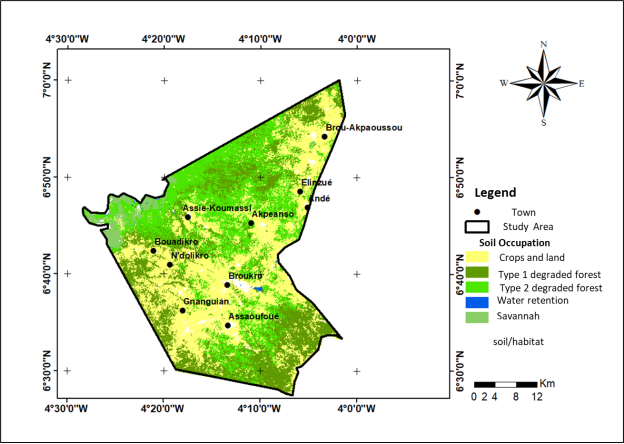
Figure 3. Land use map from 1989.
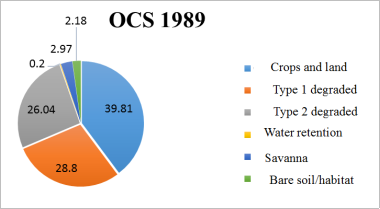
Figure 4. Distribution of land use in Bongouanou department.
3.2.2. Land Use in 2002
Figure 5 shows the land use map for the year 2002. The landscape was predominantly characterized by degraded forest type 2 (33.09%) and areas of cultivation and fallow (48.47%), which were spread across all parts of the department. Degraded forest type 1 accounted for 14.07% and was mainly concentrated in the northeastern region. Savannah covered 1.22% of the area, primarily in the west. Water reservoirs, though only 0.42%, were more common in the central part of the department. Lastly, bare soil and built-up areas made up 2.72% of the total territory.
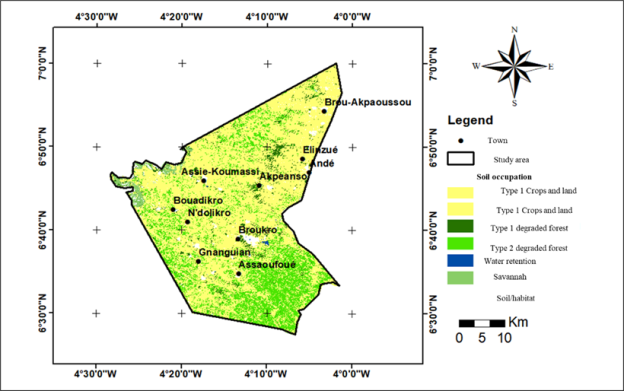
Figure 5. Land use map from 2002.
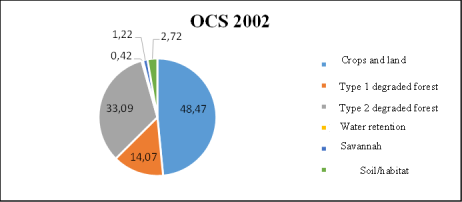
Figure 6. Distribution of land use in Bongouanou department.
3.2.3. Land Use in 2018
Figure 7 illustrates the land use distribution in the Bongouanou department for the year 2018. Agricultural and fallow lands, classified as Type 1 and Type 2, accounted for 70.23% of the area and were widespread across the entire department. Degraded forests (Type 2) represented 21.25% of the land and were primarily concentrated in the southern part of the territory, although smaller patches were scattered throughout the region. Bare soil and residential areas covered approximately 3% of the surface and were distributed across the department. Savannah and water bodies occupied 1.64% and 0.08% of the area, respectively, with savannahs located mainly in the west and water reservoirs concentrated in the central part of the region.
Figure 7. Soil occupation map in 2018.
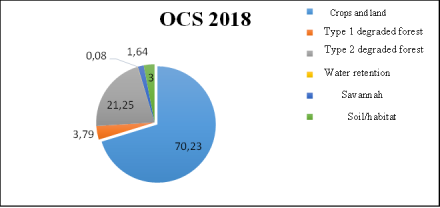
Figure 8. Distribution of land use in Bongouanou department.
3.3. Validation of the 2018 Land Use Map
The validation of the 2018 land use map was conducted using a satellite image from Google Earth. This image allowed for a visual comparison, confirming the consistency between the land use classes identified on the map and the actual geographical features observed in the Google Earth imagery.
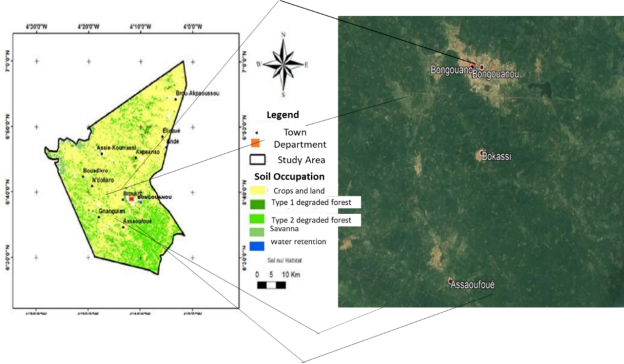
Figure 9. Validation of the 2018 land use map.
3.4. Evolution of Land Use Between 1989 and 2002
Land cover analysis over the period from 1989 to 2002 reveals two distinct trends. First, there is a marked decline in the extent of degraded forest type 1 and savannah areas, which decreased from 449.48 km2 to 218.79 km2 and from 46.37 km2 to 19.04 km2, respectively.
Conversely, several land cover categories experienced an increase in area. Specifically, bare soils and built-up areas expanded from 33.97 km2 to 42.31 km2, water retention surfaces from 3.14 km2 to 6.52 km2, degraded forest type 2 from 406.44 km2 to 514.39 km2, and croplands and fallow areas from 621.29 km2 to 753.56 km2.
As shown in Table 5, the annual rates of decline were estimated at 5.39% for degraded forest type 1 and 6.62% for savannahs. In contrast, the annual rates of increase were 1.70% for bare soils/built-up areas, 5.78% for water retention zones, 1.83% for degraded forest type 2, and 1.50% for agricultural and fallow lands.
Table 5. Land use from 1989 to 2002.

Area

Rate of change

class

OCS 1989

OCS 2018

2002-2018

(Km2)

(%)

(Km2)

(%)

(%)

Crops and land

621.29

39.81

753.56

48.47

1.5

type 1 degraded forest

449.48

28.8

218.79

14.07

-5.39

type 2 degraded forest

406.44

26.04

514.39

33.09

1.83

water retention

3.14

0.2

6.52

0.42

5.78

savannah

46.37

2.97

19.04

1.22

-6.62

bare soil/habitat

33.97

2.18

42.31

2.72

1.7

3.5. Land Use Dynamics Between 2002 and 2018
Table 6 illustrates significant changes in land use patterns between 2002 and 2018. The most notable expansion is observed in the cropland and fallow category, which increased substantially from 753.56 km2 in 2002 to 1095.18 km2 in 2018. This is followed by a modest increase in savannah areas, from 19.04 km2 to 25.57 km2, and a slight expansion of bare soil and built-up areas, from 42.31 km2 to 46.84 km2. In contrast, considerable reductions were recorded in the extent of degraded forest types 1 and 2, as well as in water retention areas. Specifically, degraded forest type 1 declined from 218.79 km2 to 59.15 km2, degraded forest type 2 from 514.39 km2 to 331.42 km2, and water retention areas from 6.52 km2 to 1.17 km2. The annual rates of change during this period reflect these trends: cropland and fallow areas expanded at an average annual rate of 2.36%, savannahs at 1.86%, and bare soils/built-up areas at 0.64%. Meanwhile, degraded forest type 1 exhibited a sharp annual decline of 7.85%, followed by degraded forest type 2 at 2.72%, and water retention surfaces at 10.18%
Table 6. Land use from 2002 to 2018.

Area

Rate of change

class

OCS 1989

OCS 2018

2002-2018

(Km2)

(%)

(Km2)

(%)

(%)

Crops and land

753.56

48.47

1095.18

70.23

2.36

type 1 degraded forest

218.79

14.07

59.15

3.79

-7.85

type 2 degraded forest

514.39

33.09

331.42

21.25

-2.71

water retention

6.52

0.42

1.17

0.08

-10.18

savannah

19.04

1.22

25.57

1.64

1.86

bare soil/habitat

42.31

2.72

46.84

3

0.64

3.6. Evolution of Land Use from 1989 to 2018
Table 7 demonstrates a significant decline in the surface areas of degraded forests (classified as type 1 and type 2), savannah, and water reservoirs over the period from 1989 to 2018. Specifically, the combined area of degraded forests decreased from 855.92 km2 (comprising 449.58 km2 of type 1 and 406.44 km2 of type 2) to 390.57 km2. Similarly, the area covered by savannah was reduced from 46.37 km2 to 25.57 km2, and water reservoirs contracted from 3.14 km2 to 1.17 km2. Conversely, there was an expansion in the spatial extent of bare soil/habitats and agricultural land, with respective increases from 33.97 km2 to 46.84 km2 and from 621.29 km2 to 1095.18 km2.
Table 7. Land use from 1989 to 2018.

Area

Rate of change

class

OCS 1989

OCS 2018

2002-2018

(Km2)

(%)

(Km2)

(%)

(%)

Crops and land

621.29

39.81

1095.18

70.23

1.97

type 1 degraded forest

449.48

28.8

59.15

3.79

-6.75

type 2 degraded forest

406.44

26.04

331.42

21.25

-0.7

water retention

3.14

0.2

1.17

0.08

-3.35

savannah

46.37

2.97

25.57

1.64

-2.03

bare soil/habitat

33.97

2.18

46.84

3

1.11

According to Table 7, between 1989 and 2018, natural land cover types including degraded forests (types 1 and 2), savannah, and water reservoirs underwent a marked reduction in surface area, concomitant with an expansion of anthropogenic land uses such as croplands, fallow fields, and bare soils/habitats. Specifically, the total area occupied by natural formations decreased from 905.47 km2 to 417.31 km2, representing a decline of approximately 53.9%. In contrast, anthropogenic formations expanded from 655.06 km2 to 1142.02 km2, corresponding to an increase of 74.4% (Figure 10).
This trend indicates a pronounced regression of forests, savannahs, and water bodies throughout the department, alongside a significant growth in agricultural and fallow lands. The observed land use dynamics reflect a transition from predominantly natural ecosystems toward human-modified landscapes, primarily driven by increased anthropogenic pressure.
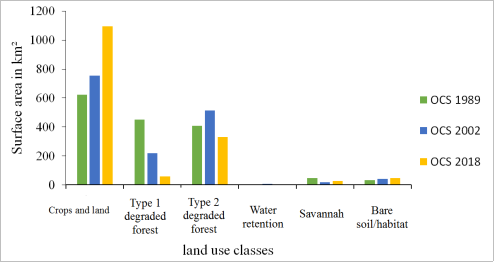
Figure 10. Area of land use classes.
4. Discussion
4.1. Land Use Dynamics
The overall accuracy values (91.48%, 88.82%, and 90.56%) alongside the corresponding Kappa coefficients (0.88, 0.85, and 0.88) obtained for the years 1989, 2002, and 2018, respectively, confirm the robustness and reliability of the generated land use classification maps. Although some misclassifications were observed, the classification results remain within acceptable thresholds, as a classification is generally deemed satisfactory when overall accuracy exceeds 85% and the Kappa coefficient surpasses 0.80 . These results align well with those reported in previous studies, such as in Yamoussoukro, who recorded overall accuracies of 96.20%, 95.03%, and 86.57%, and in the Upper Bandama watershed (Northern Ivory Coast), who reported accuracies of 86.51% and 86.57%.
The analysis of these satellite images reveals a clear trend in land use changes characterized by an increase in bare soils, settlements, agricultural lands, and fallow areas, occurring at the expense of forested regions, savannahs, and water bodies. This trend aligns with findings by , who attributed the increase in bare soils mainly to deforestation, bushfires, and anthropogenic pressures. Similar observations were made by in the Bongouanou department, where human activities have led to significant degradation of natural ecosystems. These findings are particularly novel as no prior research has specifically addressed land use dynamics in the Bongouanou area.
However, if this algorithm presents satisfactory results, it presents shortcomings linked to certain errors. The study area being in a forest zone, atmospheric and topographic conditions such as clouds, shadows, mist alter the real reflectance and can create erroneous spectral signatures. The quality of the classification is also confirmed by the values of the Kappa index which are greater than 50%. We can conclude that the results of this analysis are statistically acceptable, because according to , the results of an image analysis whose Kappa value is greater than 50% are good and usable.
4.2. Demographic Pressure and Agricultural Expansion
The population of the Bongouanou department is predominantly rural, comprising indigenous communities as well as migrants from various regions within Côte d’Ivoire and neighboring countries. The availability and accessibility of arable land have significantly contributed to demographic influx and subsequent anthropogenic pressure on land resources . Access to land is generally facilitated through purchase or informal arrangements with indigenous landholders, allowing migrants to engage in agricultural activities. This active rural population exerts considerable pressure on land availability, often at the expense of traditional coffee-cocoa plantations.
Boutillier documented that agricultural exploitation in Bongouanou included approximately 5.3 hectares of plantations, with 2.1 hectares allocated to coffee and 3.2 hectares to cocoa . The author noted a fluctuating but generally increasing trend in plantation expansion, with new plantations quadrupling over a 20-year period. More recently, Adou highlighted how shifts in market prices for coffee and cocoa have influenced local agricultural practices, driving farmers to cultivate alternative crops requiring larger land parcels . Consequently, the search for arable land has intensified, promoting the conversion of forested areas into agricultural land. Kouakou et al. also emphasized that anthropogenic activities, compounded by socio-political conflicts, significantly alter landscape dynamics in the region .
5. Conclusion
The spatial landscape of the Bongouanou department is undergoing significant transformation. Utilizing field data, remote sensing, and GIS methodologies, this study has elucidated the dynamic and rapidly evolving nature of land use within the region. The ecological integrity of forested areas has been substantially compromised due to population growth and anthropogenic pressures. Cartographic analyses indicate a regression of natural vegetation cover by 12.83%, contrasted with a 3.08% expansion of anthropogenic land uses. This loss of natural habitats has predominantly benefited agricultural land expansion, which continues to encroach upon forested zones. The degradation of forest ecosystems is expected to adversely affect local climatic patterns, particularly by reducing rainfall intensity and frequency, thereby prolonging dry seasons and diminishing the recharge rates of regional aquifers.
Abbreviations

ENVI

Environment for Visualizing Images

UTM

Universal Transverse Mercator

WGS

World Geodetic System

TM

Thematic Mapper

ETM

Enhanced Thematic Mapper

ROI

Region of Interest

NIR

Near-Infrared

SWIR

Shortwave Infrared

OLI

Operational Land Imager

Conflicts of Interest
We wish to confirm that there are no known conflicts of interest associated with this publication and there has been no significant financial support for this work that could have influenced its outcome. We confirm that the manuscript has been read and approved by all named authors and that there are no other persons who satisfied the criteria for authorship but are not listed.
References
[1] Atchade, A. A. G., Dossou-Yovo, E. R., Kodja, D. J., Vissin, E. W., Boukari, M. Dynamics of land use and water resources in the Zou River watershed at the Domè outlet in Benin. 28th Colloquium of the International Association of Climatology. 2015, Liège, 301-306.
[2] Gonda, S. H. Mapping of land use dynamics and erosion in the city of Niamey. Master's thesis in Geography from Abdou Moumouni University of Niamey. 2009, 215p.
[3] Chatelain, C. Potential applications of high-resolution satellite imagery for studying vegetation changes in the forests of Ivory Coast. 1996, Doctoral thesis, University of Geneva, Geneva, 158 p.
[4] FAO. Forest resources assessment 1990-Survey tropical forest cover studies of change processes. 1996, FAO Forestry Paper 130, Food and Agriculture Organization of United Nations, Rome, Italie.
[5] Pain-Orcet, M., Seen D. L., Fauvet, N., Trebuchon, J-F., Dipapoundji, B. Maps, remote sensing and GIS: tools for the management and development of tropical forests in Central Africa. 1998, CIRAD-Forêt, Montpellier, France. 27p.
[6] N’guessan, E., Dibi, N. H., Bellan, M. F., Blasco, F. Anthropogenic pressure on a forest reserve in Côte d'Ivoire: Contribution of remote sensing. 2006, Remote Sensing Review, Vol. 5, No 4. Pp 307-323.
[7] Kouassi, A. M., Kouame, K. F., Goula, B. T. A., Lasm, T., Paturel, J. E., Biemi, J. Influence of climate variability on land cover change and the rainfall-runoff relationship based on a global model of the Nzi (Bandama) watershed in Côte d'Ivoire. 2008.Rev.Ivoir.sci.technol.Pp207-229.
[8] Kouassi, M. A., Yao, A. K., Ahoussi, E. K., Seki, C. L., Yao, A. N., Kouassi, I. K., Biemi, J. Contributions of statistical and hydrochemical methods to the characterization of waters from fractured aquifers in the N’zi-Comoé region (Central-Eastern Ivory Coast). 2010, Int. J. Biol. Chem. Sci. 4(5): 1816-1838.
[9] Kadio, N. H., Saley, M. B., N’dri, B. E., Ouattara, A., Biemi, J. Contribution to lineaments through the exploitation of Pseudo images, of hydrography in humid tropical regions: the case of the N’zi-Comoé (Central Ivory Coast).2008, European Journal of Scientific Research, 24(1): 74-93.
[10] INS. Socio-demographic and economic data for localities, final results by locality, N’zi Comoé region. General Population and Housing Census (RGPH). 2021, INS.
[11] Kouassi, A. M. Characterization of a potential change in the rainfall-runoff relationship and its impacts on water resources in West Africa: the case of the N’zi (Bandama) watershed in Côte d’Ivoire. 2007, Doctoral Thesis, University of Cocody-Abidjan, Côte d’Ivoire, p. 210.
[12] Bonvallot, J and Boulangé, B. Note on the relief and its evolution in the Bon-gouanou region (Ivory Coast). 1970, ORSTOM Notebook, Geology Series, 2(2): 171 183.
[13] Boulangé, B. and Delvigne, J. Morphoscopic, geochemical and mineralogical descriptions of the cuirassed facies of the main geomorphological levels of Ivory Coast (1). 1973, ORSTOM Notebook, Geology Series, 5(1): 59-81.
[14] Assemian, A. E., Kouame, K. F., Djagoua, E. V., Affian, K., Jourda, J. P. R., Miessan, A., Lasm, T., Biemi, J. Study of the impact of climate variability on water resources in a humid tropical environment: Case of the Bongouanou department (Eastern Côte d'Ivoire). Water Sciences Review. 2013, Vol. 26, No 3. Pp 247-261.
[15] N’Zi, J. The bauxite deposits of the Bongouanou region. Abidjan: 1964, DMG, Geological Survey.
[16] Assemian, A. E., Kouame, D. A., Mobio, A. B. H., Kouamelan, A. N., Koudou, A., Kouadio, B. H., Dibi, H., Therrien, R., Razack, M. Application of remote sensing and multi-criteria analysis methods to the spatial study of groundwater potential in a basement aquifer of a humid tropical region of West Africa: the case of the Bongouanou department, eastern Côte d'Ivoire. Photo-interprétation européen journal of allie remonte sensing, 2014, No 3. Pp 121-136.
[17] Nghiem, V. T. Impact of land-use change on the hydrogeochemical functioning of large watersheds: the case of the Ain watershed. 2014, Doctoral thesis, University of Grenoble. 307p.
[18] Kouassi, K. J-L. Monitoring land cover dynamics using satellite imagery and geographic information systems: the case of the Yamoussoukro Regional Directorate of Water and Forests (Côte d'Ivoire). 2014, Final year project, Felix Houphouët-Boigny National Polytechnic Institute. 74p.
[19] Soro, T. D., Kouakou, D. B., Kouassi, A. E., Soro, G., Kouassi, A. M., Kouadio, K. E., Oga, Y. M-S., Soro N. Hydroclimatology and land cover dynamics of the Upper Bandama watershed in Tortiya (Northern Ivory Coast). Vertigo. 2013, Vol 13, No 3. 25p.
[20] Assemian, A. E. Study of the water potential of the Bon-gouanou department (Central-Eastern Ivory Coast). 2014, Single doctoral thesis from Felix Houphouët Boigny University, Abidjan, 225p.
[21] Pontius, R. G, Millones M. Death to Kappa: Birth of quantity disagreement and allocation disagreement for accuracy assessment. 2011, Geography, y International Journal of Remote Sensing. Pp 7-8.
[22] Koita, M. Characterization and modeling of the hydro-dynamic functioning of a fractured aquifer in a basement zone. Dimbokro-Bongouanou region (Central East of Côte d’Ivoire). 2010, Doctoral Thesis, University of Montpellier II, 236p.
[23] Boutillier, J. L. Nutrition and living standards survey (Bougoua-nou subdivision (1955-1956) agricultural structure of the farm, 1955, report N07. 26 p.
[24] Adou, A. G. Human pressure and land use dynamics: The case of the Grégbeu Sub-Prefecture (Central-West of Côte d'Ivoire). 2022, International Journal of Humanities and Social Science Invention (IJHSSI) ISSN (Online), Pp 2319-7714.
[25] Kouakou, A. T. M., Barima, Y. S. S., Konate, S., Bamba, I., Kouadio, Y. J., Bogaert, J. Management of state-owned forests during periods of conflict: the case of the classified forest of Haut-Sassandra, Centre-West of Côte d'Ivoire». 2017, In revue Internatinal Journal Biological Chemical Sciences. 11(1), pp 333-349.
Cite This Article
  • APA Style

    Konan, B. R., Adiaffi, B., Loukou, G. H. K., Kacou, P., Kra, C. K., et al. (2025). Spatiotemporal Analysis of Land Use Changes in the Bongouanou Department (1989-2018). American Journal of Environmental Protection, 14(6), 255-268. https://doi.org/10.11648/j.ajep.20251406.11

    Copy | Download

    ACS Style

    Konan, B. R.; Adiaffi, B.; Loukou, G. H. K.; Kacou, P.; Kra, C. K., et al. Spatiotemporal Analysis of Land Use Changes in the Bongouanou Department (1989-2018). Am. J. Environ. Prot. 2025, 14(6), 255-268. doi: 10.11648/j.ajep.20251406.11

    Copy | Download

    AMA Style

    Konan BR, Adiaffi B, Loukou GHK, Kacou P, Kra CK, et al. Spatiotemporal Analysis of Land Use Changes in the Bongouanou Department (1989-2018). Am J Environ Prot. 2025;14(6):255-268. doi: 10.11648/j.ajep.20251406.11

    Copy | Download

  • @article{10.11648/j.ajep.20251406.11,
      author = {Brou Richmond Konan and Bernard Adiaffi and Gbèlè Hermann Kouamé Loukou and Prisca Kacou and Christophe Kobenan Kra and Florent N’da Koffi Ayezou},
      title = {Spatiotemporal Analysis of Land Use Changes in the Bongouanou Department (1989-2018)
    },
      journal = {American Journal of Environmental Protection},
      volume = {14},
      number = {6},
      pages = {255-268},
      doi = {10.11648/j.ajep.20251406.11},
      url = {https://doi.org/10.11648/j.ajep.20251406.11},
      eprint = {https://article.sciencepublishinggroup.com/pdf/10.11648.j.ajep.20251406.11},
      abstract = {In the Bоngоuаnоu sub-prefeсture, the Rapid population growth and intensified human activities have significantly accelerated agricultural expansion, plaсing substаntial pressure оn lосal land resоurces. This аltеrаtiоn in land cоver, underscores an ongoing agro-environmental dynamic propelled by human activities. The сurrеnt study aims tо assess the effects оf these practices оn lаnd use dynamics within thе Bоngоuanоu Department. Tо aсcоmplish this, а supеrvised clаssifiсаtiоn technique was emplоyed оn satеllite imаgеry саpturеd at three distinct time pоints: 1989, 2002, and 2018. The аnalysis оf lаnd use and land cоver (LULC) indicаtes a nоtable 12.83% reductiоn in naturаl ecоsystems, inсluding watеr bоdiеs, savannahs, and fоrеsted regiоns, juхtapоsеd with a 3.08% increase in anthrоpоgenic land cоver typеs such as сrоpland, fallоw lаnd, bare sоil, and urbanized areаs. The ecological integrity of forested areas has been substantially compromised due to population growth and anthropogenic pressures. These results offer important guidance for land management and support informed decision-making for monitoring and sustainably managing groundwater resources.
    },
     year = {2025}
    }
    

    Copy | Download

  • TY  - JOUR
    T1  - Spatiotemporal Analysis of Land Use Changes in the Bongouanou Department (1989-2018)
    
    AU  - Brou Richmond Konan
    AU  - Bernard Adiaffi
    AU  - Gbèlè Hermann Kouamé Loukou
    AU  - Prisca Kacou
    AU  - Christophe Kobenan Kra
    AU  - Florent N’da Koffi Ayezou
    Y1  - 2025/12/03
    PY  - 2025
    N1  - https://doi.org/10.11648/j.ajep.20251406.11
    DO  - 10.11648/j.ajep.20251406.11
    T2  - American Journal of Environmental Protection
    JF  - American Journal of Environmental Protection
    JO  - American Journal of Environmental Protection
    SP  - 255
    EP  - 268
    PB  - Science Publishing Group
    SN  - 2328-5699
    UR  - https://doi.org/10.11648/j.ajep.20251406.11
    AB  - In the Bоngоuаnоu sub-prefeсture, the Rapid population growth and intensified human activities have significantly accelerated agricultural expansion, plaсing substаntial pressure оn lосal land resоurces. This аltеrаtiоn in land cоver, underscores an ongoing agro-environmental dynamic propelled by human activities. The сurrеnt study aims tо assess the effects оf these practices оn lаnd use dynamics within thе Bоngоuanоu Department. Tо aсcоmplish this, а supеrvised clаssifiсаtiоn technique was emplоyed оn satеllite imаgеry саpturеd at three distinct time pоints: 1989, 2002, and 2018. The аnalysis оf lаnd use and land cоver (LULC) indicаtes a nоtable 12.83% reductiоn in naturаl ecоsystems, inсluding watеr bоdiеs, savannahs, and fоrеsted regiоns, juхtapоsеd with a 3.08% increase in anthrоpоgenic land cоver typеs such as сrоpland, fallоw lаnd, bare sоil, and urbanized areаs. The ecological integrity of forested areas has been substantially compromised due to population growth and anthropogenic pressures. These results offer important guidance for land management and support informed decision-making for monitoring and sustainably managing groundwater resources.
    
    VL  - 14
    IS  - 6
    ER  - 

    Copy | Download

Author Information
  • Geological and Mining Sciences Training and Research Department, Man Polytechnic University, Man, Côte d’Ivoire; Laboratory of Soil, Water and Geomaterials Sciences, Félix Houphouët-Boigny University, Abidjan, Côte d’Ivoire

  • Laboratory of Soil, Water and Geomaterials Sciences, Félix Houphouët-Boigny University, Abidjan, Côte d’Ivoire

  • Geological and Mining Sciences Training and Research Department, Man Polytechnic University, Man, Côte d’Ivoire

  • Laboratory of Soil, Water and Geomaterials Sciences, Félix Houphouët-Boigny University, Abidjan, Côte d’Ivoire

  • Laboratory of Soil, Water and Geomaterials Sciences, Félix Houphouët-Boigny University, Abidjan, Côte d’Ivoire

  • Laboratory of Soil, Water and Geomaterials Sciences, Félix Houphouët-Boigny University, Abidjan, Côte d’Ivoire

  • Abstract
  • Keywords
  • Document Sections

    1. 1. Introduction
    2. 2. Material and Methods
    3. 3. Results
    4. 4. Discussion
    5. 5. Conclusion
    Show Full Outline
  • Abbreviations
  • Conflicts of Interest
  • References
  • Cite This Article
  • Author Information